

1. mod_status
Status 모듈은 서버 관리자에게 서버의 상태를 보여 준다. 쉽게 읽을 수 있는 HTML 페이지로 현재 서버 통계를 보여준다.
Status 모듈은 Apache 설치 시 기본적으로 탑재 되어 있으며, 빌드 시 --disable-status 옵션으로 해당 기능을 사용하지 않게 설정은 가능하다. 만약 최초 빌드 시 삭제를 했다면, 다시 Apache를 재 빌드 해야 사용이 가능하다.
1.1. 모듈 설치 확인
$ apachectl -D DUMP_MODULES | grep status
status_module (shared)1.2. 모니터링 설정
모니터링 설정 후 Apache 재기동을 해야 적용된다.
1.2.1. $APACHE_HOME/conf/httpd.conf
LoadModule status_module modules/mod_status.so

# Real-time info on requests and configuration
Include conf/extra/httpd-info.conf1.2.2. $APACHE_HOME/conf/extra/httpd-info.conf
아래 설정 내용 부분은 httpd.conf 파일에서도 설정이 가능하다.
Require host, Require ip에 설정된 주소 및 아이피로만 server-status 확인이 가능하도록 설정한 예시이다.
ExtendedStatus 옵션은 각 요청에 대한 자세한 상태 정보를 기록한다. 이 설정은 서버 전체 적용되며, Vhost별 키고 끌 수 없다. 해당 옵션을 사용 시 gettimeofday를 두 번 호출하기 때문에 Apache 성능 저하가 발생할 수 있다.
<Location /server-status>
    SetHandler server-status
    Require host www.test2.co.kr
    Require ip 127.0.0.1
</Location>

ExtendedStatus On1.3. 웹 브라우저 확인
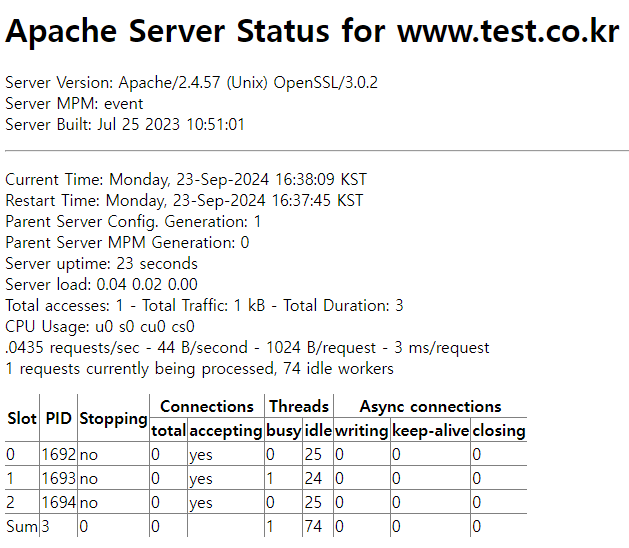
1.3.1. 브라우저 호출
- 서버가 시작 혹은 재 시작한 시간과 동작한 시간
- 쉬고 있는(Idle) Worker의 개수
- 각 Worker들의 상태, 처리한 요청의 개수와 서비스한 전체 바이트 수
- 총 접근 횟수와 서비스한 바이트 수
- 초당 요청수 평균, 초당 서비스한 바이트 수와 요청당 바이트 수 평균
- 현재 아파치 전체와 각 Worker들의 CPU 사용율
- 현재 처리하고 있는 호스트와 요청
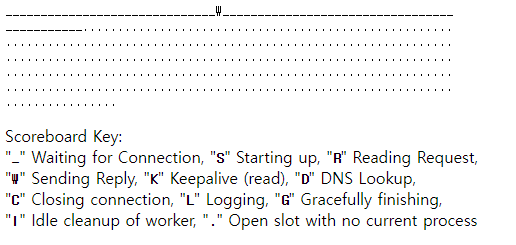
- 스코어 보드 Key
Key값은 아래 스코어 보드 화면 M열에 표시가 된다.
| key | 설 명 |
| "-" | 요청 대기 중인 Connection(프로세스 있음) |
| "S" | 시작 중인 상태 |
| "R" | 요청을 읽는 중 |
| "W" | 응답을 보내는 중 |
| "K" | 연결 상태를 유지하는 중 |
| "D" | DNS 검색 중 |
| "C" | 연결이 닫히는 중 |
| "." | Idle Worker(프로세스 없음) |
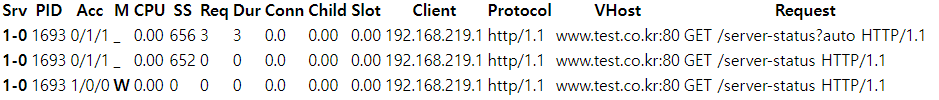
- ExtendedStatus 설정 시 확인되는 정보
| 제 목 | 내 용 |
| Srv | 자식 프로세스 Slot 번호 |
| PID | 프로세스 ID |
| Acc | 현재 연결 / 자식 프로세스 수 / 슬롯 액세스 수 |
| M | 프로세스 별 통신 상태(Scoreboard Key) |
| CPU | 초당 CPU 사용률 |
| SS | 최근 요청의 시작부터 초 단위 표시 |
| Req | 최근 요청 처리 시간(ms) |
| Dur | 모든 요청 처리 시간(ms) |
| Conn | Connection에 전송된 양(kb) |
| Child | 자식 프로세스에 전송된 양(mb) |
| Slot | 슬롯에 전송된 양(mb) |
- 1초 마다 server-status 호출 하는 예시
http://domain주소/server-status?refresh=1- Parsing 하기 쉽게 호출 하는 예시
http://domain주소/server-status?auto1.4. 서버 확인
1.4.1. 요약 정보 확인
$ apachectl status
               Apache Server Status for localhost (via 127.0.0.1)

   Server Version: Apache/2.4.57 (Unix)
   Server MPM: event
   Server Built: May 28 2024 22:49:26
     __________________________________________________________________

   Current Time: Monday, 03-Jun-2024 23:31:39 UTC
   Restart Time: Monday, 03-Jun-2024 23:31:16 UTC
   Parent Server Config. Generation: 1
   Parent Server MPM Generation: 0
   Server uptime: 23 seconds
   Server load: 0.00 0.02 0.00
   Total accesses: 0 - Total Traffic: 0 kB - Total Duration: 0
   CPU Usage: u0 s0 cu0 cs0
   0 requests/sec - 0 B/second
   1 requests currently being processed, 74 idle workers

   Slot  PID  Stopping   Connections    Threads      Async connections
                       total accepting busy idle writing keep-alive closing
   0    81660 no       0     yes       0    25   0       0          0
   1    81661 no       0     yes       1    24   0       0          0
   2    81662 no       0     yes       0    25   0       0          0
   Sum  3     0        0               1    74   0       0          0

_________________________________________________W______________
___________.....................................................
................................................................
................................................................
................................................................
................................................................
................

   Scoreboard Key:
   "_" Waiting for Connection, "S" Starting up, "R" Reading Request,
   "W" Sending Reply, "K" Keepalive (read), "D" DNS Lookup,
   "C" Closing connection, "L" Logging, "G" Gracefully finishing,
"I" Idle cleanup of worker, "." Open slot with no current process1.4.2. 상세 정보 확인 (ExtendedStatus On)
 $ apachectl fullstatus

 # 추가적으로 아래 내용을 확인 할 수 있다.

 Srv PID Acc M CPU SS Req Dur Conn Child Slot Client Protocol VHost
   Request
   1-0 81661 0/1/1 _ 0.00 128 0 0 0.0 0.00 0.00 localhost http/1.1
   192.168.219.131:80 GET /server-status HTTP/1.0
   2-0 81662 1/0/0 W 0.00 0 0 0 0.0 0.00 0.00 127.0.0.1 http/1.1
   192.168.219.131:80 GET /server-status HTTP/1.0
     __________________________________________________________________

    Srv  Child Server number - generation
    PID  OS process ID
    Acc  Number of accesses this connection / this child / this slot
     M   Mode of operation
    CPU  CPU usage, number of seconds
    SS   Seconds since beginning of most recent request
    Req  Milliseconds required to process most recent request
    Dur  Sum of milliseconds required to process all requests
   Conn  Kilobytes transferred this connection
   Child Megabytes transferred this child
Slot Total megabytes transferred this slot2. OS 모니터링
2.1. 프로세스 확인
2.1.1. Apache Server MPM 방식 확인
$ apachectl -V | grep MPM
Server MPM: event2.1.2. httpd-mpm.conf에 MPM 방식 설정 값으로 Process가 구동 중인지 확인
아래 예시는 event 방식일 경우 확인한 예이다. StartServers 3, daemon 기동 프로세스 3인 것을 확인
$ vi httpd-mpm.conf
<IfModule mpm_event_module>
    StartServers             3
    MinSpareThreads         75
    MaxSpareThreads        250
    ThreadsPerChild         25
    MaxRequestWorkers      400
    MaxConnectionsPerChild   0
</IfModule>

$ ps -ef | grep httpd
web@jsh2:~/apache/conf/extra$ ps -ef | grep httpd
root       82652       1  0 01:27 ?        00:00:00 /sw/web/apache/bin/httpd -k start
daemon     82653   82652  0 01:27 ?        00:00:00 /sw/web/apache/bin/httpd -k start
daemon     82654   82652  0 01:27 ?        00:00:00 /sw/web/apache/bin/httpd -k start
daemon 82655 82652 0 01:27 ? 00:00:00 /sw/web/apache/bin/httpd -k start2.2. Port 확인
Apache httpd.conf 파일에 설정된 Port값이 LISTEN 상태인지 확인
$ vi httpd.conf
Listen 80

$ netstat -anop | grep httpd
tcp6 0 0 :::80 :::* LISTEN 82652/httpd3. 서비스 모니터링
3.1. systemctl status
- Loaded : 로드 된 서비스
- Active : active 상태와 기동된 시점
- Process : Pid와 Service 시작 시 기동되는 명령 스크립트 정보
- Tasks : 실행되는 Tasks의 수
- CGroup : Unit에 속한 Process
$ systemctl status apache.service
● apache.service - apache
     Loaded: loaded (/lib/systemd/system/apache.service; disabled; vendor preset: enabled)
     Active: active (running) since Tue 2024-06-04 01:32:57 UTC; 4s ago
    Process: 83098 ExecStart=/sw/web/apache/bin/apachectl start (code=exited, status=0/SUCCESS)
   Main PID: 83101 (httpd)
      Tasks: 82 (limit: 4515)
     Memory: 5.9M
        CPU: 12ms
     CGroup: /system.slice/apache.service
             ├─83101 /sw/web/apache/bin/httpd -k start
             ├─83102 /sw/web/apache/bin/httpd -k start
             ├─83103 /sw/web/apache/bin/httpd -k start
             └─83104 /sw/web/apache/bin/httpd -k start

Jun 04 01:32:57 jsh2 systemd[1]: Starting apache...
Jun 04 01:32:57 jsh2 systemd[1]: Started apache.3.2. Service Log 확인
- journalctl : systemd의 Service Log를 분석하기 위한 명령어
- journalctl 옵션
- u : 특정 서비스 데몬 로그 보기
- b : 마지막 부팅 후 로그 보기
- --since : 특정 기간 별 로그 확인
- --since=today : 오늘 날짜 로그 확인
- --since "1 hour ago" : 한 시간 전 로그
- --since "2024-06-01 00:00:00" -until "2024-06-02 00:00:00" : 시작 부터 종료 시점 날짜의 로그
- f : 마지막 로그 부터 확인
- journalctl log 보관 주기 설정
- /etc/systemd/journald.conf 파일에서 size 지정 및 보관주기 설정이 가능
'WEB > Apache' 카테고리의 다른 글
| [Apache] SSL 설정 (0) | 2025.03.12 |
|---|---|
| [Apache] 가상 호스트 (0) | 2025.03.11 |
| [Apache] Rewrite 설정 (0) | 2024.09.23 |
| [Apache] 에러 모음집 (0) | 2024.05.08 |
| [Apache] WAS 연동 (0) | 2024.04.22 |
1. mod_status
Status 모듈은 서버 관리자에게 서버의 상태를 보여 준다. 쉽게 읽을 수 있는 HTML 페이지로 현재 서버 통계를 보여준다.
Status 모듈은 Apache 설치 시 기본적으로 탑재 되어 있으며, 빌드 시 --disable-status 옵션으로 해당 기능을 사용하지 않게 설정은 가능하다. 만약 최초 빌드 시 삭제를 했다면, 다시 Apache를 재 빌드 해야 사용이 가능하다.
1.1. 모듈 설치 확인
$ apachectl -D DUMP_MODULES | grep status
 status_module (shared)
1.2. 모니터링 설정
모니터링 설정 후 Apache 재기동을 해야 적용된다.
1.2.1. $APACHE_HOME/conf/httpd.conf
LoadModule status_module modules/mod_status.so

# Real-time info on requests and configuration
Include conf/extra/httpd-info.conf
1.2.2. $APACHE_HOME/conf/extra/httpd-info.conf
아래 설정 내용 부분은 httpd.conf 파일에서도 설정이 가능하다.
Require host, Require ip에 설정된 주소 및 아이피로만 server-status 확인이 가능하도록 설정한 예시이다.
ExtendedStatus 옵션은 각 요청에 대한 자세한 상태 정보를 기록한다. 이 설정은 서버 전체 적용되며, Vhost별 키고 끌 수 없다. 해당 옵션을 사용 시 gettimeofday를 두 번 호출하기 때문에 Apache 성능 저하가 발생할 수 있다.
<Location /server-status>
    SetHandler server-status
    Require host www.test2.co.kr
    Require ip 127.0.0.1
</Location>

ExtendedStatus On
1.3. 웹 브라우저 확인
1.3.1. 브라우저 호출
- 서버가 시작 혹은 재 시작한 시간과 동작한 시간
- 쉬고 있는(Idle) Worker의 개수
- 각 Worker들의 상태, 처리한 요청의 개수와 서비스한 전체 바이트 수
- 총 접근 횟수와 서비스한 바이트 수
- 초당 요청수 평균, 초당 서비스한 바이트 수와 요청당 바이트 수 평균
- 현재 아파치 전체와 각 Worker들의 CPU 사용율
- 현재 처리하고 있는 호스트와 요청
- 스코어 보드 Key
Key값은 아래 스코어 보드 화면 M열에 표시가 된다.
| key | 설 명 |
| "-" | 요청 대기 중인 Connection(프로세스 있음) |
| "S" | 시작 중인 상태 |
| "R" | 요청을 읽는 중 |
| "W" | 응답을 보내는 중 |
| "K" | 연결 상태를 유지하는 중 |
| "D" | DNS 검색 중 |
| "C" | 연결이 닫히는 중 |
| "." | Idle Worker(프로세스 없음) |
- ExtendedStatus 설정 시 확인되는 정보
| 제 목 | 내 용 |
| Srv | 자식 프로세스 Slot 번호 |
| PID | 프로세스 ID |
| Acc | 현재 연결 / 자식 프로세스 수 / 슬롯 액세스 수 |
| M | 프로세스 별 통신 상태(Scoreboard Key) |
| CPU | 초당 CPU 사용률 |
| SS | 최근 요청의 시작부터 초 단위 표시 |
| Req | 최근 요청 처리 시간(ms) |
| Dur | 모든 요청 처리 시간(ms) |
| Conn | Connection에 전송된 양(kb) |
| Child | 자식 프로세스에 전송된 양(mb) |
| Slot | 슬롯에 전송된 양(mb) |
- 1초 마다 server-status 호출 하는 예시
http://domain주소/server-status?refresh=1- Parsing 하기 쉽게 호출 하는 예시
http://domain주소/server-status?auto1.4. 서버 확인
1.4.1. 요약 정보 확인
$ apachectl status
               Apache Server Status for localhost (via 127.0.0.1)

   Server Version: Apache/2.4.57 (Unix)
   Server MPM: event
   Server Built: May 28 2024 22:49:26
     __________________________________________________________________

   Current Time: Monday, 03-Jun-2024 23:31:39 UTC
   Restart Time: Monday, 03-Jun-2024 23:31:16 UTC
   Parent Server Config. Generation: 1
   Parent Server MPM Generation: 0
   Server uptime: 23 seconds
   Server load: 0.00 0.02 0.00
   Total accesses: 0 - Total Traffic: 0 kB - Total Duration: 0
   CPU Usage: u0 s0 cu0 cs0
   0 requests/sec - 0 B/second
   1 requests currently being processed, 74 idle workers

   Slot  PID  Stopping   Connections    Threads      Async connections
                       total accepting busy idle writing keep-alive closing
   0    81660 no       0     yes       0    25   0       0          0
   1    81661 no       0     yes       1    24   0       0          0
   2    81662 no       0     yes       0    25   0       0          0
   Sum  3     0        0               1    74   0       0          0

_________________________________________________W______________
___________.....................................................
................................................................
................................................................
................................................................
................................................................
................

   Scoreboard Key:
   "_" Waiting for Connection, "S" Starting up, "R" Reading Request,
   "W" Sending Reply, "K" Keepalive (read), "D" DNS Lookup,
   "C" Closing connection, "L" Logging, "G" Gracefully finishing,
   "I" Idle cleanup of worker, "." Open slot with no current process
1.4.2. 상세 정보 확인 (ExtendedStatus On)
 $ apachectl fullstatus

 # 추가적으로 아래 내용을 확인 할 수 있다.

 Srv PID Acc M CPU SS Req Dur Conn Child Slot Client Protocol VHost
   Request
   1-0 81661 0/1/1 _ 0.00 128 0 0 0.0 0.00 0.00 localhost http/1.1
   192.168.219.131:80 GET /server-status HTTP/1.0
   2-0 81662 1/0/0 W 0.00 0 0 0 0.0 0.00 0.00 127.0.0.1 http/1.1
   192.168.219.131:80 GET /server-status HTTP/1.0
     __________________________________________________________________

    Srv  Child Server number - generation
    PID  OS process ID
    Acc  Number of accesses this connection / this child / this slot
     M   Mode of operation
    CPU  CPU usage, number of seconds
    SS   Seconds since beginning of most recent request
    Req  Milliseconds required to process most recent request
    Dur  Sum of milliseconds required to process all requests
   Conn  Kilobytes transferred this connection
   Child Megabytes transferred this child
   Slot  Total megabytes transferred this slot
2. OS 모니터링
2.1. 프로세스 확인
2.1.1. Apache Server MPM 방식 확인
$ apachectl -V | grep MPM
Server MPM:     event
2.1.2. httpd-mpm.conf에 MPM 방식 설정 값으로 Process가 구동 중인지 확인
아래 예시는 event 방식일 경우 확인한 예이다. StartServers 3, daemon 기동 프로세스 3인 것을 확인
$ vi httpd-mpm.conf
<IfModule mpm_event_module>
    StartServers             3
    MinSpareThreads         75
    MaxSpareThreads        250
    ThreadsPerChild         25
    MaxRequestWorkers      400
    MaxConnectionsPerChild   0
</IfModule>

$ ps -ef | grep httpd
web@jsh2:~/apache/conf/extra$ ps -ef | grep httpd
root       82652       1  0 01:27 ?        00:00:00 /sw/web/apache/bin/httpd -k start
daemon     82653   82652  0 01:27 ?        00:00:00 /sw/web/apache/bin/httpd -k start
daemon     82654   82652  0 01:27 ?        00:00:00 /sw/web/apache/bin/httpd -k start
daemon     82655   82652  0 01:27 ?        00:00:00 /sw/web/apache/bin/httpd -k start
2.2. Port 확인
Apache httpd.conf 파일에 설정된 Port값이 LISTEN 상태인지 확인
$ vi httpd.conf
Listen 80

$ netstat -anop | grep httpd
tcp6       0      0 :::80                   :::*                    LISTEN      82652/httpd
3. 서비스 모니터링
3.1. systemctl status
- Loaded : 로드 된 서비스
- Active : active 상태와 기동된 시점
- Process : Pid와 Service 시작 시 기동되는 명령 스크립트 정보
- Tasks : 실행되는 Tasks의 수
- CGroup : Unit에 속한 Process
$ systemctl status apache.service
● apache.service - apache
     Loaded: loaded (/lib/systemd/system/apache.service; disabled; vendor preset: enabled)
     Active: active (running) since Tue 2024-06-04 01:32:57 UTC; 4s ago
    Process: 83098 ExecStart=/sw/web/apache/bin/apachectl start (code=exited, status=0/SUCCESS)
   Main PID: 83101 (httpd)
      Tasks: 82 (limit: 4515)
     Memory: 5.9M
        CPU: 12ms
     CGroup: /system.slice/apache.service
             ├─83101 /sw/web/apache/bin/httpd -k start
             ├─83102 /sw/web/apache/bin/httpd -k start
             ├─83103 /sw/web/apache/bin/httpd -k start
             └─83104 /sw/web/apache/bin/httpd -k start

Jun 04 01:32:57 jsh2 systemd[1]: Starting apache...
Jun 04 01:32:57 jsh2 systemd[1]: Started apache.
3.2. Service Log 확인
- journalctl : systemd의 Service Log를 분석하기 위한 명령어
- journalctl 옵션
- u : 특정 서비스 데몬 로그 보기
- b : 마지막 부팅 후 로그 보기
- --since : 특정 기간 별 로그 확인
- --since=today : 오늘 날짜 로그 확인
- --since "1 hour ago" : 한 시간 전 로그
- --since "2024-06-01 00:00:00" -until "2024-06-02 00:00:00" : 시작 부터 종료 시점 날짜의 로그
- f : 마지막 로그 부터 확인
- journalctl log 보관 주기 설정
- /etc/systemd/journald.conf 파일에서 size 지정 및 보관주기 설정이 가능
'WEB > Apache' 카테고리의 다른 글
| [Apache] SSL 설정 (0) | 2025.03.12 |
|---|---|
| [Apache] 가상 호스트 (0) | 2025.03.11 |
| [Apache] Rewrite 설정 (0) | 2024.09.23 |
| [Apache] 에러 모음집 (0) | 2024.05.08 |
| [Apache] WAS 연동 (0) | 2024.04.22 |